Thursday, December 31, 2015

Dart scores for 2015

I read someplace that if you practice something for five minutes a day you should see improvement over time. This past year I put that to the test and played darts for five minutes almost every day. On Saturday I played a game of baseball and tracked those scores. In March I started playing two games to get a better sense of how I was going. I chose darts because there is basically no setup time required and it is easy to quantify improvement over time.

Too bad I was aiming at the 1
It took me a while to come up with a training routine that I felt comfortable with and seemed to produce results. I didn't want to just throw darts randomly or play the same game every night so I used several strategies throughout the year. At first I was just aiming for the 20 or the 3 and was happy when all of the darts hit the top half or bottom half of the board respectively. Over time I got more specific and aimed for different sections. At the end I was running through the numbers and wouldn't progress to the next number until I hit the target with at least one dart.

I also experimented with my stance to find the most comfortable position. This didn't take as long but it did seem to make a big difference in my improvement. Getting to the point where I was consistent with my throws was definitely a major part of the process.

Over time I definitely saw improvement. While I wouldn't say that I'm a very good dart player I am happy with what I have seen this year and I plan to keep practicing on a regular basis.  I probably won't make a point of playing five minutes every day, but I will try to get a few games in every week.

You can see a chart of my scores for the year here on Tableau.
Tracking dart scores for 2015

Thursday, November 26, 2015

Thanksgiving

I have had an interesting few weeks leading up to Thanksgiving this year. It's hard to believe while I'm sitting in the comfort of my father's house that only two weeks ago I was in Les Cayes Haiti on a mission trip with the Carlisle United Methodist church. That was my third trip to Haiti and every time I have been there it reminds me of how lucky I am to have grown up in a safe place with family and friends that care about me. We never had a lot of money growing up, but I can't remember ever really being hungry or going a day without a meal. The situation for the people we were working with in the small community of Deroche can't say the same. Having been there so recently makes Thanksgiving a little more poignant this year than it has been in the past.

The humility I felt from the trip was reinforced last week when several Tibetan Buddhist monks visited Dickinson College. They were there creating a sand mandala which is a process that involves intent concentration and patience. After spending most of a week on the project the sand is swept up and poured into moving water. It is amazing to see people spend so much time on something and then just sweep it away as if it were nothing. I believe that the exercise is meant to reinforce the Buddhist idea of impermanence and that we really shouldn't get attached to things of this world. As I would walk through the Library and see the monks at work I usually thought back to the people in Haiti that have so little to let go of in the first place. They probably don't need the lessons that a Buddhist monk would convey as much as I do, but I can't help but wonder how they would receive it anyway.

I feel like I could say so much more about this but the words just aren't coming out. I just hope that as we move into Christmas time I can hold on to these feelings of thankfulness and appreciation for what I have.

Thursday, October 15, 2015

PSBA Conference Day 2

Today was a shorter day at the conference but I still got a lot out of it.

The first session I attended was presented by several folks from Southern York County School District titled "Transforming Factory Schools into 21st Century Teaching and Learning Centers." They went through their process of implementing their one to one program starting with the question: What is the goal of education today? One common phrase that we hear a lot in education is that every student should make a year of growth every year. Central to SYC's mentality is that every student and every teacher should make a year of growth every year. Placing an emphasis on both students and teachers is important when you want to transform your school and they appear to be doing a great job at Southern York.

They showed us the first few minutes of a TedX talk by L. Todd Rose on the Myth of Average. The short version of the video (which is worth watching in its entirety) is that when we design for the average we aren't designing for anyone. This leads to customized learning when applied to schools and education. Before diving into a one to one program they ran two pilot groups with students. The 16 students first spent four weeks with iPads and then another four weeks with Chromebooks. After the evaluation the students chose the Chromebooks due to several factors, including the keyboard, ease of use and sharing and collaboration features. I asked about this after the talk because the collaboration can be done on iPads but the students felt that it just worked better on the Chromebooks. Students continued to have input into the program including on issues of policy which I feel is a great idea. The students also proposed setting up a student run tech support center which was implemented with the help of the Librarian and their IT staff. Along with these efforts that are student based Southern York is also making efforts to customize their faculty learning processes in order to help them make yearly progress, too. Overall I was very impressed with the presentation and took a lot away from it.

The next presentation was "Evaluating and Assessing your Digital Learning Initiatives" presented by
Randy Ziegenfuss and Lynn Fuini-Hetten from Salisbury Township School District. This was also a very well put together presentation on Salisbury's efforts on digital learning and it is obvious that this district has put a lot of time and energy into their initiatives. They were sharing with us how to run through the entire process of creating and evaluating an initiative from concept to implementation to data collection and evaluating that data. One of the most wonderful things they have done is made all of their work available online at www.tl2020.org. They did not focus on the particular technologies used in their district but instead talked about methodology and process, which was great.

The third talk of the day was "Examining the PA School Performance Profile" by Dr. Ed Fuller from Penn State. Dr. Fuller runs the Center for Evaluation and Education Policy Analysis and shared his research on school performance profiles and systems like PVAAS. He has found that the best correlation between schools and SPP scores is rooted in poverty rates and little else. The implications of this are that poor schools receive poor SPP scores and their funding is affected adversely because of this. The result is that their funding gets reduced, which lowers their scores and begins a downward spiral or poorer and poorer results. His research was interesting but unfortunately his message isn't being heard very well by those making decisions in Harrisburg.
The only session tomorrow is the closing remarks which are being given by Robert Fulghum. I'm looking forward to hearing him speak and I'm also already thinking about next year's conference and getting more involved with PSBA. There is so much to learn as a school board member and I don't think we should be left out of the equation of making a year of progress every year, either.

Wednesday, October 14, 2015

PSBA Conference Day 1

I'm attending the Pennsylvania School Board Association Leadership Conference for the first time this year which started today. I have been to my fair share of professional conferences before but I still wasn't sure what to expect from a conference like this. While being on the school board is a voluntary position the conference is also for school administrators as it is also hosted by the Pennsylvania Association of School Administrators. This means that it is a professional conference for folks like superintendents, assistant superintendents and intermediate unit executives. This makes for an interesting mix of folks that have a lot of experience in the K-12 education space and others of us that happened to get elected to be their bosses. I don't know about other board members but sometimes the things we talk about take a while to digest and I know that I have a lot to learn about which is one of the reasons that I decided to attend the conference.

The opening keynote was given by Dr. Heidi Grant Halverson on the topic of a Get Better Mindset. Dr. Halverson spoke about the difference between a "Be Good" mindset where we are judged based on comparisons to others and a "Get Better" mindset where we are judged against ourselves. The latter encourages self improvement and working through difficult situations. Other benefits include being more willing to innovate even with the possibility of failure.
(Tweet from Dr. Hotchkiss, the Bermudian Springs Superintendent)

Dr. Halverson cited a lot of research to support her assertions and if you are interested I highly recommend that you explore her work further.

The second session I attended was given by Dr. James P. Capolupo titled "Behind the Curtain: Tackling the Myths and Mysteries of the School Superintendent Position." His talk was divided into things you should try and things you shouldn't try. Thankfully our superintendent already does most of the things Dr. Capolupo recommends and the things that he recommended not doing but we do anyway come down to cultural differences between where he was a superintendent and Bermudian Springs.

After lunch I attended "Augmenting Reality with Aurasma: Bringing Objects to Life" presented by several teachers from the North Hills School District. Unfortunately it took them more than half an hour to get to the promised demonstration of the Aurasma app, but the talk was still very good. They have their 8th grade social studies classes create multimedia projects for each section of the class before the exam. This allows the students to demonstrate their knowledge and gives the teachers the ability to correct any misunderstandings before the exam takes place. The students create these projects using various apps on iPads which also gives them tools to express their creativity. Some of my favorite examples from the presentation include making stop motion movies to talk about the Jamestown Settlement and using an app called Book Creator to create iBooks compatible books that describe the Declaration of Independence to a 3rd grader. The Aurasma app was used to place augmented reality pictures around the school that gave information about Presidents and how they are like Sesame Street characters.

The last session of the day was presented by Blanca Duarte from LogicWing. She spoke about the concept of deep learning and how schools can use technology to encourage it in our schools. Her presentation included several small group activities which yielded interesting conversation with other school board members. One of the most important things that I gleaned from this talk was pointers to resources from Intel on using technology in education, including Intel Teach Elements which is a series of modules that teachers can use free of charge. I also learned that Intel has an Education division which provides consulting services on how schools can incorporate technology into their curriculum.

Between sessions I also visited the exhibit hall and had several good conversations with various vendors. Interestingly I found myself wearing my Dickinson College User Services hat and checking out technologies that might be useful for our environment there.

Day one of the conference was a good experience and I'm looking forward to day two.

Wednesday, August 19, 2015

Bermudian Springs SAT scores over time

Here's another example of some work I did learning Tableau. This shows the SAT scores for Bermudian Springs over time. The formatting in Blogger makes this difficult to view, so you might be better off viewing it at Tableau Public.

Monday, April 06, 2015

Learning Tableau for data visualization

Tableau is a software package used for data visualization. I have heard of it before and it came up again as part of the Emerging Technologies Working Group that I am leading at work. Normally I'm the kind of person that needs a practical reason to learn a software tool and until recently I didn't have any data visualization needs so Tableau was kind of on the back burner. A few weeks ago, however, I started to have some questions about Supreme Court decisions and decided I would try to answer my questions using Tableau. My question is whether there have been more cases decided recently with a five vote majority opinion than in years past.

Step 1: Getting the data
The first step to answering my question is getting access to data on Supreme Court cases. I checked the website for the Supreme Court and while they do have data on decisions available I did not find an easily exportable list of what I was hoping to visualize. After some web searching I found the Supreme Court Database and it has exactly what I need. The Supreme Court Database has a dataset of decisions from the 1946 through 2013 terms which includes a ton of information regarding all cases brought before the court. They offer this data as a CSV download in several different formats. I chose to download case centered data organized by court citation. Since I am not well versed in the workings of the court it is possible that this isn't the best dataset to use, but for the purposes of learning the software it was sufficient.

Step 2: Getting the software
Tableau offers a 30 day trial of their desktop software so I downloaded it and got started. They also offer a web based version but I wanted to experiment with the desktop version more.

Step 3: Creating a new workbook and adding data
Tableau is similar to Excel in that you have workbooks that contain data and graphs. When you create a new workbook the first thing you need to do is add data. Unlike Excel you need to connect to a datasource which can be something as simple as a file or as complex as a database server. My data is in a CSV file so I directed Tableau to connect to the file I downloaded from the Supreme Court Database.

Tableau classifies information in the data as either a Dimension or a Measure. Basically dimensions a are headers (text, dates, etc.) and measures are axes on a graph (numbers).

Step 4: Creating my first graph
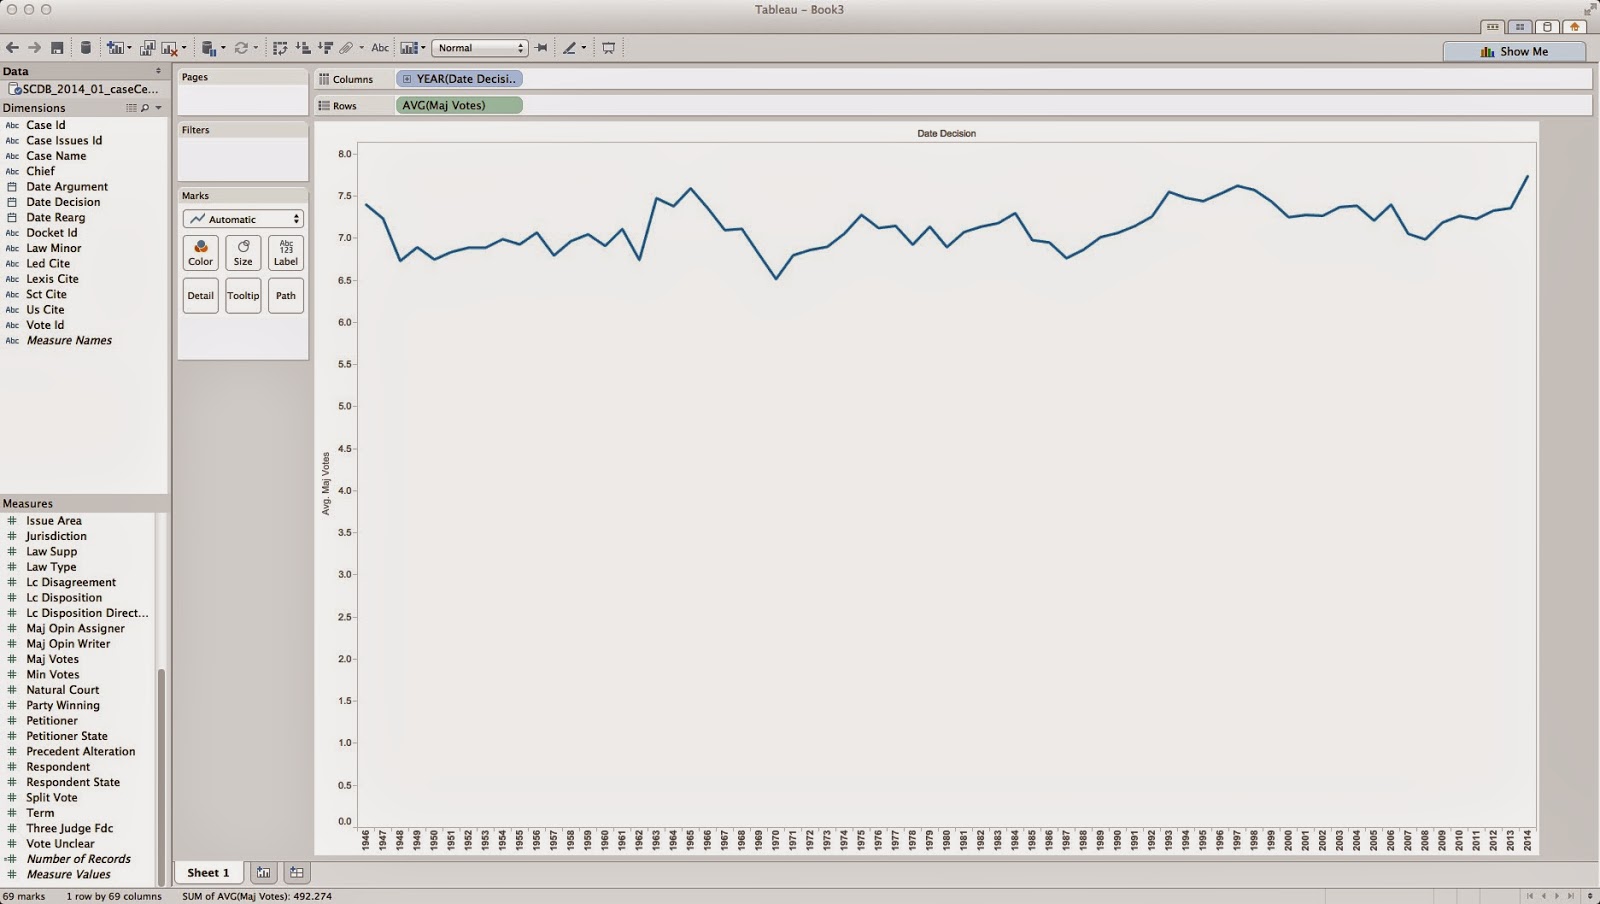
Once Tableau is connected to your data you can create a worksheet. Tableau's interface gives you the ability to setup rows and columns for creating either tables or graphs. Since I was interested in votes over time I used the "Date Decision" dimension for my column and the "Maj Votes" measure as my rows. Tableau defaults to calculate the sum of majority votes which really isn't useful, so I switched this to the average which provides a little more information.

This graph shows the average majority vote per year. If there were more cases being decided with a five vote majority then this graph should show the average vote approaching five over time. As you can see, that is not clearly the case. And in fact, if you turn on trend lines (Analysis, Trend Lines, Show Trend Lines) Tableau shows that the average majority vote count is going up per year, and not down. 

But what if I wanted a graph showing the number of cases decided by five votes per year? This is a different graph that requires counting majority votes but only those that have a value equal to five. I created a new worksheet with "Date Decision" as my column and "Maj Votes" as my rows, but this time I asked Tableau to show the Count of "Maj Votes". This graph should show the number of dockets before the court each year since each docket has a number in the "Maj Votes" column of the data. Next I dragged the "Maj Votes" measure into the Filters pane to apply a filter to the data. I filtered for a range of values between five and five and turned on Trend Lines to generate the following graph:

So, it looks like the number of cases decided by five votes is not increasing over time. 

There is a major issue with my data and conclusion, however. I am simply counting the number of cases decided by five votes and not the percentage of cases. My graphs don't include the total number of cases, so my conclusion may not be accurate. Tableau does include functionality to create calculated fields but I haven't figured that out, yet. Stay tuned to see if my initial graphs were misleading or not.


Friday, March 27, 2015

Converting files from Google Drive to Microsoft OneDrive (Office365)

I'm a huge Google person and use their services for most of my personal needs (email, blogging, video sharing, etc.). I have been using Google Drive and the Docs and Sheets apps for my word processing and other needs for several years and in general have been very happy with the performance and improvements they have made. At both work and school it is great to have access to my documents wherever I am and on whatever device I'm using at the time.

That being said, Microsoft is also making huge pushes into cloud computing and their Office365 offering is now fairly stable and mature. Dickinson College (where I work) has recently been moving towards official support for these services as they are now included in our Microsoft Campus license agreement. In order to help acquaint myself with the services I have been making an effort to use them more frequently and one of the first things I wanted to do was make a copy of my Google Drive "Work" folder on Microsoft's OneDrive service. Since my computer is now setup to sync to both services this shouldn't be difficult, however, Google's file formats are really just pointers to the web services, so the files need to be converted to Office formats for this to really work.

There are two ways to handle this conversion, one way would take a very long time, depending on the number of files you have, and the other will save you a ton of time. I'm going to document both here for reference, but if you are making a similar transition then the second method is the one you should use.

Converting a Google Docs file to Office

  1. Open the file you want to convert in Google Docs.
  2. Click File, Download As, Microsoft Word (.docx).
    Note that if you are working with a spreadsheet you will get the option to save as Microsoft Excel (.xlsx) instead.
  3. The converted file will download.
You can use this process to convert files one at a time and this can be useful when you need to share a file with someone and they need it in Word or another format. This function is also useful for creating PDF versions of documents to distribute.


Converting an entire folder at once
Google will allow you to convert multiple files at once and this will be more helpful for making a wholesale transition from Drive to another service. 

  1. Login to Google Drive.
  2. Highlight the folder containing the files you want to convert.
    Note that you can select multiple files and folders by holding in the Ctrl key on a Windows machine and the Command key on a MacOS machine and clicking the subsequent files.
  3. Click the three dots in the upper right corner below the Google bar.
  4. Click Download.
  5. Google will prepare a zip file containing all of your files. Docs will be converted to Word format (.docx) and Sheets will be converted to Excel (.xlsx).
  6. Open the zip file and extract your converted documents. These can now be placed in your OneDrive folder or anyplace else that you want to store them.


Wednesday, November 12, 2014

The Church and Science

I heard a great interview on NPR's Here and Now program the other day about Guy Consolmagno, a Vatican astronomer that received the Carl Sagan Medal. Dr. Consolmagno is a Jesuit that planned on teaching at a Jesuit college but instead was sent Vatican City initially and now works for at of the Church's observatories. The interview covered topics in religion and science and was very thought provoking for me. Here's a link to the story which includes the audio:
http://hereandnow.wbur.org/2014/11/11/vatican-astronomer-sagan-medal

Tuesday, September 30, 2014

Augsburg Confession Biblical References Part 2

I did some more reading on uses of Gephi, particularly this post on Facebook Network Analysis. I'm really just learning how to use this software and a very powerful feature for analysis is included that I didn't know about earlier: network analysis. Network analysis looks at a set of data and sorts the nodes into categories or sub-networks based on the connections between the nodes. In Gephi this is done with modularity plugin and the results can be very interesting. Not only are the results more visually appealing but the conclusions and directions for further research are more readily apparent.

Here is an updated network graph of the biblical references in the Augsburg Confession.
You can explore this graph interactively here.
When I prepared this graph I did a few things differently. The first major change is the layout chosen for the nodes. In my initial work I used a layout algorithm that tried to fit everything into a spherical pattern which looks nice but doesn't group things by how well they are related in particular. The new graph uses the "Force Atlas" algorithm. As you can see it groups the nodes by how closely they are related so visually browsing the data is much more effective. I also ran the modularity algorithm on the data which allows you to color code the nodes based on the categories that it finds. For this work I asked the software to find eight categories since that is the default.

The combination of the different layout and the color coding makes a few things immediately apparent.

There are two articles named Concerning Confession, one of them is doctrinal in nature and the other suggests reforms. It doesn't take network analysis to guess that these would be related. What is interesting from the graph, however is how far they are from the other articles. Of the verses referenced in these two articles, only Psalm 119:50 is referenced in another, Article 28 Concerning the Church's Power.

There are a few articles which are further removed from the others and stand alone; Concerning Justification, Concerning the New Obedience and Concerning the Church. The only one of these which is grouped with another article is Concerning the Church which has been placed with Concerning Faith and Good Works because they both reference Ephesians. This group also contains a third article, Concerning the Cause of Sin which also only references one verse from John. A more rigorous analysis of the texts of these three articles would show how closely these are related in language and content.

Two articles which do share similar viewpoints and are grouped together using this method are Concerning the Marriage of Priests and Concerning Monastic Vows. Despite the fact that these articles only reference one verse in common, 1 Corinthians 7:2, the modularity algorithm placed them in the same group and the layout algorithm has them near each other probably because of the relationships between these articles and others that they share more in common with in terms of references. It is interesting to see that they are placed together based on what the models know which is only biblical references and not based on actual content. The content of these articles is very similar however as they both deal with changes to monastic culture although one speaks particularly to the celibate lifestyle of priests and the other speaks to issues regarding the vows of monks.

As I learn more about the capabilities of the Gephi software it is becoming a much more useful and powerful tool for analysis. I plan to do some more research on this topic from both a technology and the theology point of view and will keep reporting what I find.

Saturday, September 27, 2014

An analysis of Bible references in the Augsburg Confession

I'm taking Lutheran Confessions this semester and we just read the Augsburg Confession. Many of the articles include Biblical References so I decided to do some analysis of them and if anything interesting could be found.

For those of you not familiar with the Augsburg Confession it was written by Philip Melanchthon beginning in 1529. The original document was presented at the Diet of Augsburg on June 25th, 1530 in both German and Latin. It was read in German so that the people of Augsburg could understand it but was printed in Latin for submission to Emperor Charles in Latin, as he did not know German. It was later expanded slightly and published in 1531. The purpose of the document was a defense of the positions being taken by Martin Luther and his followers who were attempting to reform the Catholic Church. While the two versions are very similar the wordings in some are different. Surprisingly there are some variations in the biblical references and for the purposes of this research I included references found in both the German and Latin texts.

The confession consists of twenty eight articles; the first twenty one articles set out the doctrinal positions of the reformers and the next seven discuss suggested reforms for the church. The document plays a dual role of defining positions of a movement but also condemning other reform movements at the same time. The Editor' Introduction in The Book of Concord: The Confessions of the Evangelical Lutheran Church includes the following: "In doing so [Melanchthon] sought to show that the theology taught in Wittenberg remained true to the catholic tradition, both by stating the biblical truth and by condemning false teachings also rejected by Roman Catholic opponents." (Kolb, Robert, Timothy J Wengert, and Charles P Arand. The Book of Concord: The Confessions of the Evangelical Lutheran Church. Minneapolis: Fortress Press, 2000. 28)

Of the twenty eight articles there are biblical references in eighteen:
4 Concerning Justification
6 Concerning the New Obedience
7 Concerning the Church
8 What Is the Church
11 Concerning Confession
12 Concerning Repentence
16 Concerning Civic Affairs
18 Concerning Free Will
19 Concerning the Cause of Sin
20 Concerning Faith and Good Works
21 Concerning the Cult of the Saints
22 Concerning Both Kinds
23 Concerning the Marriage of Priests
24 Concerning the Mass
25 Concerning Confession
26 Concerning the Distinction of Foods
27 Concerning Monastic Vows
28 Concerning the Church's Power

Within these articles there are a total of seventy seven references to twenty one books of the Bible:

Relationships between articles and books
Acts
Colossians
1 Corinthians
2 Corinthians
Ephesians
Exodus
Galatians
Genesis
Hebrews
Jeremiah
John
1 John
Luke
Mark
Matthew
1 Peter
Philippians
Psalms
Romans
1 Timothy
Titus


Relationship between articles and book chapters
The image shows a network diagram that indicates the connections between articles and the books of the Bible that they reference. I chose to create this kind of graph because it can make discerning connections between nodes more apparent. By studying this graph it is possible to see which articles rely on material from the same books and it is also immediately clear which article references the most number of books, Article XXVIII Concerning the Church's Power. The weight of the lines is based on the number of connections so you can also see that this article references 2 Corinthians more than other books. We can also see that the books of Matthew and 1 Corinthians are referenced by seven articles but most are only referenced by one.

Since many of the books in the Bible cover more than one topic I thought it would be useful to go down another level and look at the book and chapter references. When looking at this level there are fifty four unique references so the network graph of connections between articles and references will get more complicated.


Since there are so many more nodes in this graph it becomes more difficult to easily spot relationships. The chapters which only have one reference are moved to the outside of the graph so those are quickly apparent. Looking at nodes closer to the center of the graph we can see that Acts 5, for instance, has connections to both Article XVI Concerning Civic Affairs and Article XVIII Concerning the Church's Power. We can also see that Matthew 15 has three connections of varying weight so it is possible to discern that is more heavily referenced than other chapters.

Going another layer deeper things get even more confusing. I tried looking at the book, chapter and starting verse of the references and the graph becomes so populated that it is very difficult to distinguish much of meaning. However, by removing the labels and tweaking the settings of the software you can make a pretty picture.

In a future post I'll share how I developed these graphs and include some of the data that went into creating them.

Update: thanks to Todd Bryant I discovered that these graphs can be exported so they can be explored without the Gephi software. I have posted them here:
Article to Book References
Article to Book and Chapter References
Article to Book, Chapter and Verse References

Saturday, February 22, 2014

Buddhism and "The Gift of Men"

I was reading the introductory chapter on Buddhism in Finding God Among Our Neighbors earlier today and was struck by the description of Dr. Largen's description of the Buddha's final moments:
"The Buddha lived and taught for eighty years, choosing for himself when it was time for him to end his life and attain final nirvana. He entered into final meditation peacefully, lying on his side, surrounded by all manner of animals, disciples, and even gods..."[79]
For those that aren't familiar with Buddhism or may have an incorrect knowledge of it, nirvana can be described as a release from the cycle of samsara or the cyclical nature of our universe. The reason I was struck by this passage is because although I was familiar with the concepts of samsara and nirvana before reading this chapter I did not remember hearing the description of Buddha's death, if we can use that term for his final moments. The way Dr. Largen phrased Buddha's choice also brought this passage from a favorite book of mine to mind:
"Nay, lady, I am the last of the Númenóreans and the latest King of the Elder Days; and to me has been given not only a span thrice that of Men of Middle-earth, but also the grace to go at my will, and give back the gift. Now, therefore, I will sleep."
 This passage is of course from The Return of the King by J.R.R. Tolkien. The reason this came to mind was the gift that Aragorn refers to is what is called "The Gift of Men." The Gift of Men was given to humans by Ilúvatar and part of the gift was the ability to lay down at the time of their choosing and die. The Kings of Númenór had the custom of using this gift to escape Middle Earth before they became too feeble to rule and this is exactly what Aragorn was doing when he lay down and slept. Another aspect of the Gift of Men was a complete release from Middle Earth which is opposed to the Elves which have their immortality. While immortality may seem like a greater gift the Elves came in time to be jealous of the Gift of Men because their immortality lead to a longing for release due to the ages of care and woe they would experience as the millennia wore on.

While Middle Earth does not have a cyclical nature like the Buddhists believe in, I was struck by this similarity between the religion and the story. In both there are the very wise which have the ability to choose their own time to depart their world. These very wise are the leaders of the people and they are given a great amount of dignity to deal with how and when they depart the mortal coil, and I find that a wonderful and enlightening coincidence.

Tuesday, February 18, 2014

Theodicy and A Song of Ice and Fire

One of the assignments my MAR Keynote course in January was to write a paper that engaged a theological loci with popular culture. For my paper I wrote on theodicy and engaged with George R. R. Martin's A Song of Ice and Fire series. The title of the paper is "Theodicy and a Song of Ice and Fire, or Why do so many bad things happen to the Starks?" It is a very brief treatment of the topic and only addresses a potential theodicy surrounding the old gods worshipped by the Stark family but I thought some folks might enjoy reading it.

The paper is embedded in an iframe below. If the iframe isn't visible the paper is also available via Google Drive.

Tuesday, February 11, 2014

Religion and Digital Technologies

Last week I attended a one day conference at The Center for the Study of Religion at Princeton University titled Religion and Digital Technologies. It was an interesting conference and I wanted to share some notes and observations from the talks. Some of the speakers employed more technologies in the research than others and I'm only highlighting things here that I found especially interesting.

The first speaker was John Boy from CUNY. His subject of research is church plants in Europe and part of his research necessitated searching websites for specific subject matter. He used data from commoncrawl.org which provides "an open repository of web crawl data that can be accessed and analyzed by everyone." The data is accessible via the Amazon Cloud so John had to do some coding in order to perform his research.

A few of the speakers used Amazon's Mechanical Turk service at various points in their research. The Mechanical Turk allows you to create small jobs which they call Human Intelligence Tasks or "HITs" that you pay workers to complete. One speaker used Mechanical Turk to find websites for over six thousand non-profit organizations so that she could analyze their websites (the IRS provided the organizations but not the websites). Other speakers had used the service to field test surveys, which was an interesting concept. An unexpected conversation around Mechanical Turk was the ethics of using a service that pays workers the equivalent of less than $2/hour of labor.

Thomas Carlson from Princeton spoke about the challenges of developing a hierarchy to classify religions as part of the syriaca.org project. They felt a need to classify religions in some way in order to enhance the search methods available on the site but things get messy very quickly when you start to consider the different possibilities. There weren't any clear cut ways to setup a meaningful hierarchy so the project is still looking for a good solution to the issue. A term which came out of this discussion that I enjoyed was "fuzzy specificity" which refers to using dates (and other data) that we aren't sure about.

Joseph Blankholm spoke about a website which came out of a class on the religion life in Harlem. The religionsofharlem.org site has lost much functionality due to maintenance issues but everyone agreed that it was a wonderful idea. Students in the class were tasked with visiting sites of religious significance in Harlem and blogging about them. The blog posts were geolocated and the website had a map showing the blog posts by location. Joseph shared that the students got a lot out of the course and the professors had hoped to use the site as a resource for future classes but that didn't turn out as they planned. We had a discussion around the value of maintaining digital work like this and why it isn't always necessary to move course work into a permanent repository, and indeed why sometimes that would be problematic.

Marcus Bingenheimer from Temple shared some challenges that arose when digitizing Dunhuang Manuscripts. An interesting part of this discussion was how complex text encoding can become when you are working with non-western languages.

Ben Johnston and Michael Myers, both from Princeton, spoke about two projects they collaborated on and Ben mentioned a term that he holds to and I really liked. The concept is called "modest DH" (digital humanities) and it speaks to not using the technology to dazzle the audience but to make sure there is a focus on functionality. The point of digital humanities should be to allow great research and interpretation, not necessarily make things look awesome. There is a place for design and for sites meant for a broad public audience that's important, but when working on sites intended for scholars flashy elements should be left behind.

Overall I found the day enjoyable and picked up some great resources and areas that I'd like to spend more time on. If you have any questions about the day's topics, please feel free to leave a comment.


Friday, February 07, 2014

Inter-religious Dialogue Prezi

In class last week Dr. Largen covered three reasons why Christians should practice inter-religious dialogue. The reasons started with ourselves as Christians, cycled through other religions, God and then came back to Christians in a way that reminded me of the three arrows in the recycling logos. I turned this idea over in my head for a few days (turned over, recycling, get it, ha ha) and finally put together a Prezi to illustrate it. Unfortunately you can't embed Prezi presentations in Blogger so I'll have to link to it: http://prezi.com/b0wwwtcogxmk/why-should-we-practice-inter-religious-dialogue/

Saturday, January 11, 2014

The value of silence

I just read an interesting piece on the effects of iPhones on our neurology by Ian H. Robertson: http://theconversation.com/weve-got-the-iphone-habit-so-whats-it-doing-to-our-brains-21768

The big takeaway I took from the article was the need for silence after learning something new. Since I'm still in the religious mindset from class this morning I of course started to think about how this applies to worship settings. The traditional liturgy has times of silence built into it and I'm wondering if this tradition has carried into contemporary services at all. My recollection from the few that I have attended is that there was not much time for silence. This is probably because society seems to be losing its willingness to suffer silence so the designers of new worship liturgies have removed them. The evidence would suggest that this silence is more valuable than we thought.

Friday, January 10, 2014

Why I link to Worldcat

We make choices every day and one of the things that I have learned while at seminary is to try and look at the deeper meaning behind our choices and to really think deeply about our actions. One choice you have to make when blogging involves what to do when mentioning a book. It seems like the norm on the internet is to link to the book's Amazon page. On many levels this makes good sense

  • if someone is reading your blog then there's a very good chance they will know about Amazon
  • they are a trusted seller on the internet
  • it is very rare to find books that aren't listed and available on Amazon
Personally when it comes to books I prefer Barnes and Noble. I still enjoy going to a brick and mortar store to peruse the shelves and I realize the financial realities that they need to also sell books online in order to keep those physical locations open. Because of that I used to link to the bn.com pages for books instead of Amazon.com.

The more I thought about this practice, however, the more I started to question my motivations. I also gave some thought to the explicit and implicit messages I was sending to whoever clicked on the link I had made. I was certainly endorsing whichever company I linked to and recommending their services to those that trusted me enough to read my words. But what wasn't I saying at the same time? What options were being left out?

Whenever I mention a book title I have now made the choice to link to Worldcat. Worldcat is "the world's largest library catalog" and links to libraries worldwide. Because the website can find your location geographically they can find the libraries closest to you that have the book you are viewing. I feel that linking to this kind of resource sends a different message, and it is one that speaks a message about community and not capitalism. The Library used to be as much the center of community as the church, but many local libraries no longer have the funding they need to stay viable and are closing. One of the reasons they are closing is because people just aren't going to the Library anymore so local municipalities don't feel the need to provide funding. Also, the library doesn't have the opportunity to build relationships with local donors.

If more of us start directing our readers to the local library instead of the huge booksellers, that might change. In my opinion more community is a good thing, more relationship with the others around us is a good thing. And that's why I link to Worldcat.

Thursday, January 09, 2014

Hey God

Yesterday we talked about being in relationship with God (it's really been a theme of the entire week, I guess) and the language we use for God came up during the lecture at some point. I was reminded about a woman from Pittsburgh that would sometimes open her prayers by saying "Hey God...". She spoke this unconventional prayer opening once and said that it helped to remind her that she has a deeply personal relationship with God and that she needs to remember that even though God is much greater than her, God is still close to her like an earthly parent. Looking back I think it's wonderful that she had this insight and was also able to share this comfort with the rest of us.

I just read "A Big Heart Open to God" from America and while there were many interesting thoughts there I wanted to highlight Pope Francis' thoughts on art. It's worth seeing who he lifts up as authors and artists and he mentions a particular piece by Mozart, so of course I had to find a performance of it on YouTube. I have listened to three performances of Et Incarnatus Est at this point and have loved each one. Here's the one playing right now:

Wednesday, January 08, 2014

Can you Google troth?

I read an interesting blog post on the NYTimes today by Haider Javed Warraich titled When Doctors ‘Google’ Their Patients. As I was reading it I started to wonder what would happen if we replaced doctors with pastors and patients with parishioners. I can imagine that this is happening already in the world already, although I have a feeling that pastors might not be as willing to discuss it as this doctor was. For some reason it seems like an even larger violation of trust in my eyes.

In his book "To know as we are known : a spirituality of education"Parker Palmer talks about truth which comes from relationships and a deeper knowing that we can attain when we really enter into an understanding with a subject. This deep relationship leads to "troth" between the two subjects, which is a covenant that binds the two together. This relationship is possible because God knows us first.

When pastors enter a relationship with members of their congregation there should be intent to build those relationships to the point of gaining this kind of troth. Part of this relationship should include an honesty and openness on both sides which I think should mean we don't have to Google in order to know. Dr. Warraich is saying the same thing about the doctor patient relationship, I think. Doctors should be speaking with their patients and asking the right kinds of questions and patients should be answering truthfully and not holding anything back. This is the only way that trust can be gained between both parties and truth can be learned which leads to troth.

Tuesday, January 07, 2014

Webcam video from January 7, 2014 9:49 PM

In light of today's discussion I made a Vlog post instead of a blog post today.


Monday, January 06, 2014

What's on the front page?

One of our readings for the MAR Keynote course is from Heidi A. Campbell, titled Understanding the Relationship between Religion Online and Offline in a Networked Society. The article is quite long and covers a wide range of other literature (the references section is eight pages long!) but gives an interesting look at some of the differences and similarities between how religion is practiced both offline and online. Dr. Campbell lays out five central traits of what she terms "networked religion:" networked community, stored identity, shifting authority, convergent practice, and multisite reality.

The section that I found most interesting was on shifting authority and in particular there is one passage that I wanted to lift up for thought: "It is recognized that the structure of web sites and discussion forums offers a platform of influence often not available to users offline, as they become interpreters of religious belief and culture online." (page 11). This made me pause and consider how the structure our a church's website may relate to what that church is trying to say and to whom it is saying it. This topic is also discussed in the Click 2 Save book that I mentioned yesterday.

When my church first started to talk about setting up a website I encouraged that those involved with the design be very intentional about the entire thing. Unfortunately there was very little interest in being involved and I ended up putting together the site myself quickly. The result is a very basic site with quite limited functionality. My initial intention was to provide the information that I thought was most pertinent to people that are searching the web for churches to visit, so I included our address and when we worship. Since that first debut I have added a nicer cover photo and we now have archived recordings of sermons, so the audience may have widened to include parishioners that couldn't attend and want to listen to the message, but for the most part there really isn't much content there.

In light of this I'm now wondering what a fresh pair of eyes sees when they view our website. If the major thing we are presenting is where and when we meet, what does that say about our message? Does it say anything about us at all?