Showing posts with label visualization. Show all posts

Friday, December 30, 2016

Was 2016 Really that bad for actors?

There has been a lot of talk about this year being bad for a lot of folks. We certainly lost a lot of celebrities this year like Prince, David Bowie, Carrie Fisher and many more. I was curious if 2016 was worse than other years for losing actors and actresses so I decided to make a visualization (of course). Most people don't know this, but the Internet Movie Database has downloadable text versions of their database available online. Here is what a section from the biographies file looks like:
NM: 'K', Murray the

RN: Murray Kaufman

NK: The Fifth Beatle

DB: 14 February 1922, New York City, New York, USA

DD: 21 February 1982, Los Angeles, California, USA (cancer)

BG: Murray the K was born Murray Kaufman in New York, New York, on 14
BG: February 1922. After an early career as a song-plugger, he moved into
BG: radio and in 1958 joined 1010 WINS. He remained there for seven years,
BG: becoming the most popular New York radio DJ. He was an early supporter
BG: of singer Bobby Darin, inspired and then 'broke' his hit single,
BG: 'Splish-Splash', and made a guest appearance on his "This is Your Life"
BG: TV tribute in late 1959.
BG:
BG: In 1964, he was one of the first Americans to interview The Beatles,
BG: firstly by phone, later joining them in their hotel suite. From then on
BG: he acted as their "Mr. Fix-it", arranging for them to visit all the
BG: best clubs and restaurants. He also championed their records and for a
BG: while, he dubbed himself "the fifth Beatle" and became a trusted friend
BG: of the group during their American tours, though not of manager Brian
BG: Epstein, who apparently resented his considerable influence.
BG:
BG: He left WINS in 1965 and later resurfaced as a presenter on WOR-FM - the
BG: first FM rock station.
BG:
BG: Married six times, he died of cancer on 21 February 1982, in Los
BG: Angeles, California.

BY: Anonymous

SP: * 'Jacklyn Zeman' (qv) (14 February 1979 - 1981) (divorced)

TR: * Legendary disk jockey who made his name at WINS (New York) in the 1950s
TR:   and 60s; a pioneer of progressive radio at WOR-FM (New York) in 1966.
TR: * Biography in: "The Scribner Encyclopedia of American Lives". Volume One,
TR:   1981-1985, pages 443-444. New York: Charles Scribner's Sons, 1998.
TR: * Father of 'Peter Altschuler'.
TR: * In 1963 took his 1010WINS NYC Radio show to the High Schools in the New
TR:   York City area as part of a "stay in school" campaign.

AT: * "Creem" (USA), March 1973, Vol. 4, Iss. 10, pg. 20+22, by: Gerrit Graham, "Da "K" Still Cruisin' In Big Apple"

-------------------------------------------------------------------------------

Using PowerShell I extracted the DD lines into a new text file:
Get-Content .\biographies.list | Select-String -Pattern "^DD:" > deaths.txt

I then used Excel to perform some data cleanup and create broad categories of causes of death. The method I used to do this was probably not the best, but it works. I nested six if statements that searched the Cause column for keywords with an output for the appropriate category.

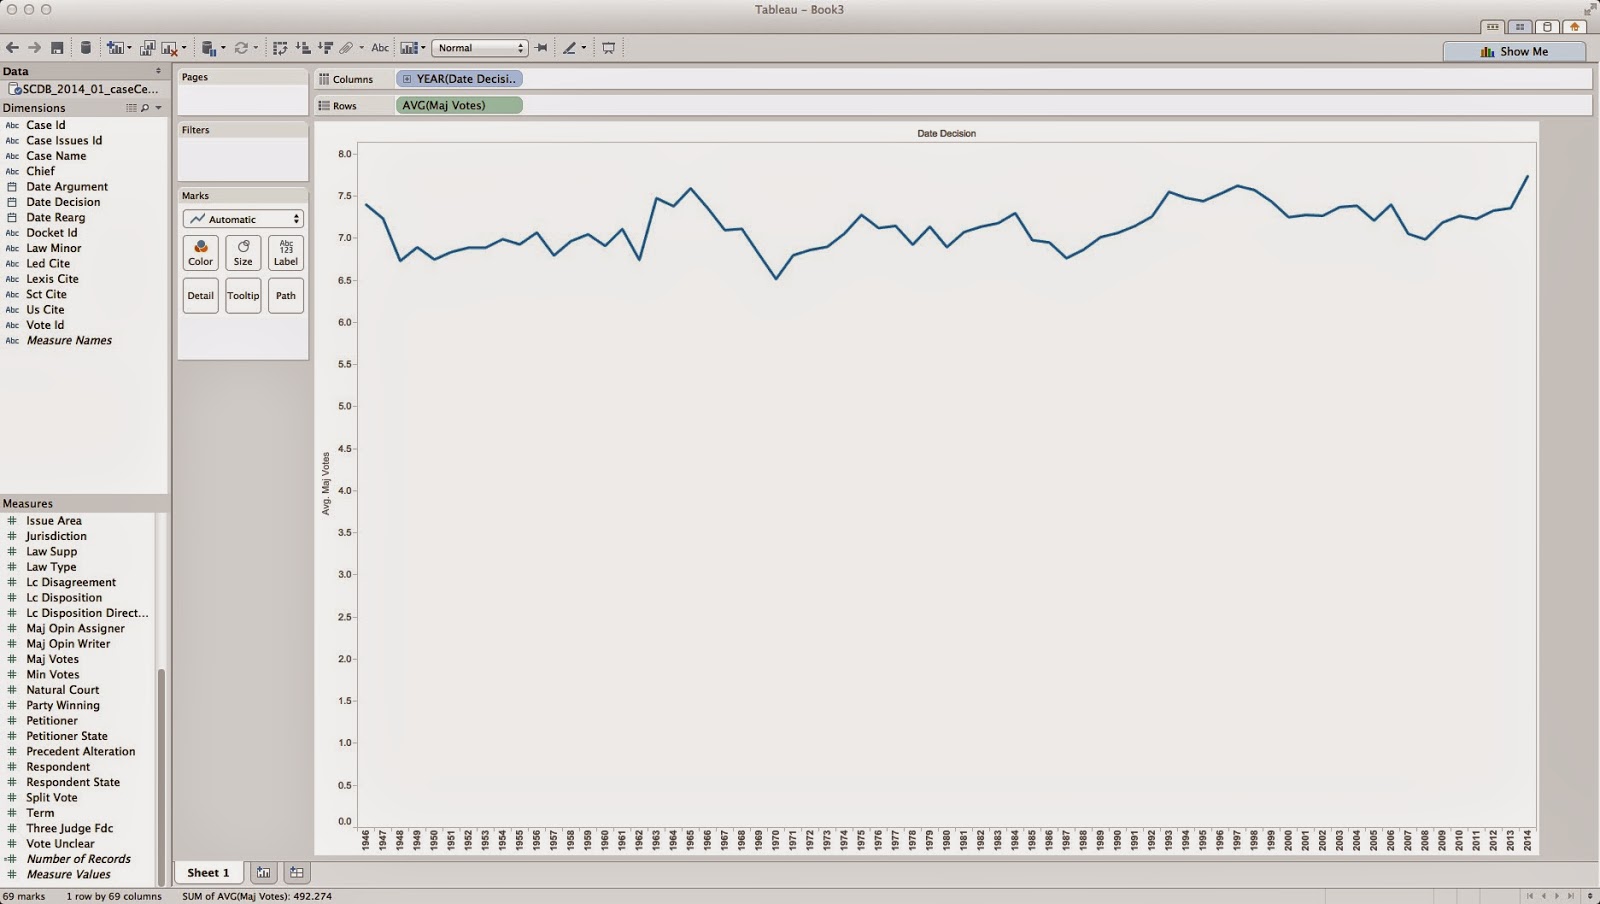
The resulting file was suitable for use in Tableau Public to create a visualization which can be viewed online and I have pasted a screenshot below. Note that the online version is interactive, please check it out.

The graph shows that deaths in 2016 are actually down from 2015 by about 500. It is difficult to know how accurate the data from IMDB is, however, so I'm not sure if that will make anyone feel any better.


Monday, April 06, 2015

Learning Tableau for data visualization

Tableau is a software package used for data visualization. I have heard of it before and it came up again as part of the Emerging Technologies Working Group that I am leading at work. Normally I'm the kind of person that needs a practical reason to learn a software tool and until recently I didn't have any data visualization needs so Tableau was kind of on the back burner. A few weeks ago, however, I started to have some questions about Supreme Court decisions and decided I would try to answer my questions using Tableau. My question is whether there have been more cases decided recently with a five vote majority opinion than in years past.

Step 1: Getting the data
The first step to answering my question is getting access to data on Supreme Court cases. I checked the website for the Supreme Court and while they do have data on decisions available I did not find an easily exportable list of what I was hoping to visualize. After some web searching I found the Supreme Court Database and it has exactly what I need. The Supreme Court Database has a dataset of decisions from the 1946 through 2013 terms which includes a ton of information regarding all cases brought before the court. They offer this data as a CSV download in several different formats. I chose to download case centered data organized by court citation. Since I am not well versed in the workings of the court it is possible that this isn't the best dataset to use, but for the purposes of learning the software it was sufficient.

Step 2: Getting the software
Tableau offers a 30 day trial of their desktop software so I downloaded it and got started. They also offer a web based version but I wanted to experiment with the desktop version more.

Step 3: Creating a new workbook and adding data
Tableau is similar to Excel in that you have workbooks that contain data and graphs. When you create a new workbook the first thing you need to do is add data. Unlike Excel you need to connect to a datasource which can be something as simple as a file or as complex as a database server. My data is in a CSV file so I directed Tableau to connect to the file I downloaded from the Supreme Court Database.

Tableau classifies information in the data as either a Dimension or a Measure. Basically dimensions a are headers (text, dates, etc.) and measures are axes on a graph (numbers).

Step 4: Creating my first graph
Once Tableau is connected to your data you can create a worksheet. Tableau's interface gives you the ability to setup rows and columns for creating either tables or graphs. Since I was interested in votes over time I used the "Date Decision" dimension for my column and the "Maj Votes" measure as my rows. Tableau defaults to calculate the sum of majority votes which really isn't useful, so I switched this to the average which provides a little more information.

This graph shows the average majority vote per year. If there were more cases being decided with a five vote majority then this graph should show the average vote approaching five over time. As you can see, that is not clearly the case. And in fact, if you turn on trend lines (Analysis, Trend Lines, Show Trend Lines) Tableau shows that the average majority vote count is going up per year, and not down. 

But what if I wanted a graph showing the number of cases decided by five votes per year? This is a different graph that requires counting majority votes but only those that have a value equal to five. I created a new worksheet with "Date Decision" as my column and "Maj Votes" as my rows, but this time I asked Tableau to show the Count of "Maj Votes". This graph should show the number of dockets before the court each year since each docket has a number in the "Maj Votes" column of the data. Next I dragged the "Maj Votes" measure into the Filters pane to apply a filter to the data. I filtered for a range of values between five and five and turned on Trend Lines to generate the following graph:

So, it looks like the number of cases decided by five votes is not increasing over time. 

There is a major issue with my data and conclusion, however. I am simply counting the number of cases decided by five votes and not the percentage of cases. My graphs don't include the total number of cases, so my conclusion may not be accurate. Tableau does include functionality to create calculated fields but I haven't figured that out, yet. Stay tuned to see if my initial graphs were misleading or not.